search
Spain rain map
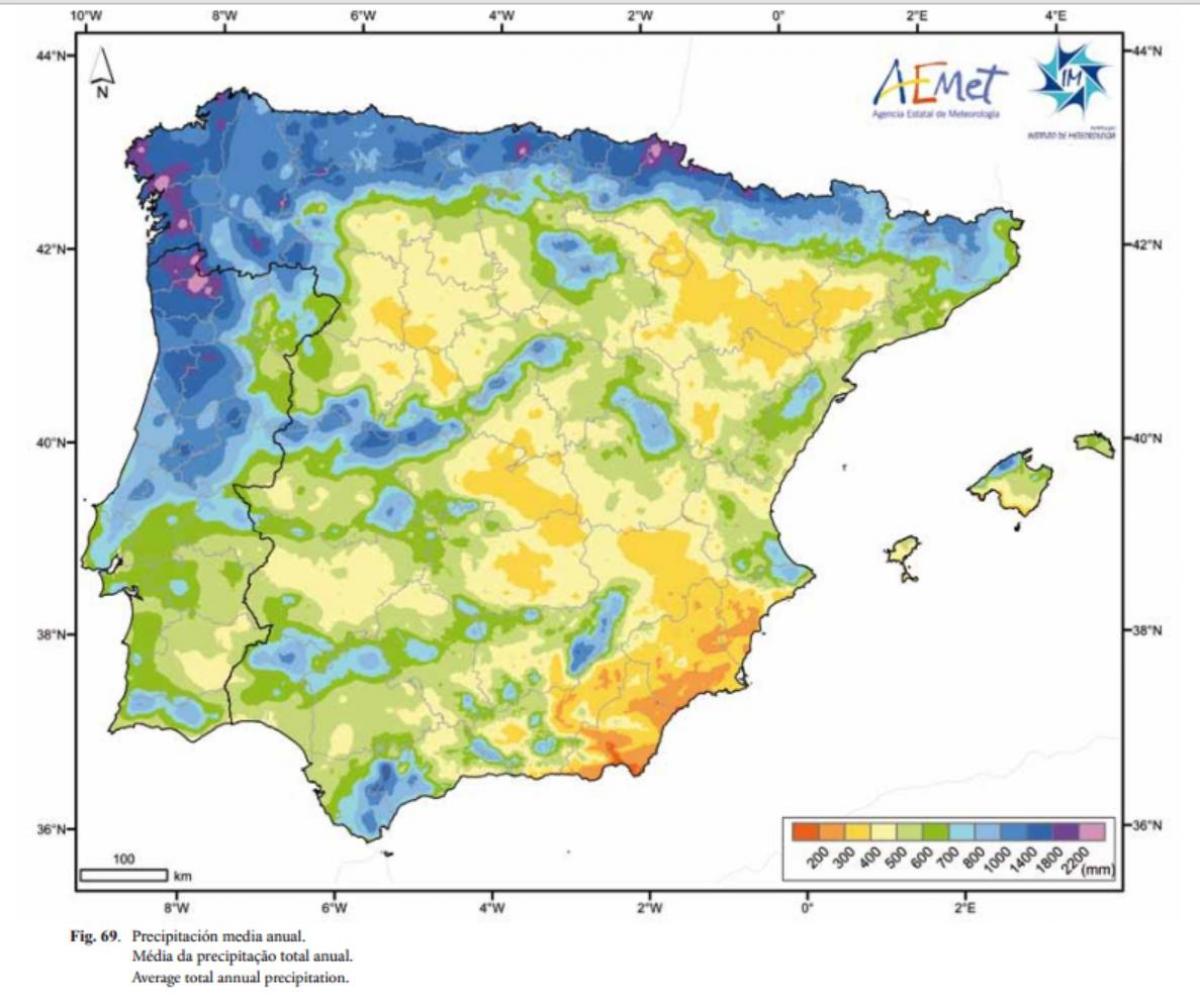
Spain rainfall map. Spain rain map (Southern Europe - Europe) to print. Spain rain map (Southern Europe - Europe) to download. Regardless of whether the rain in Spain stays mainly in the plain, the truth is the Mediterranean country experienced one of its wettest years in 2018, with over eight hundred millimeters of rainfall recorded. For instance, March, which up to 2017 featured an average of approximately 66 millimeters of rain, registered a record amount of 163 millimeters in 2018 as its shown in Spain rain map. In 2019, the November ranked as the wettest month with an average monthly rainfall of 111.6 millimiters.
In northern Spain area, the rains are abundant, and some rain may also fall in summer. In Santander, more than 1,100 mm (43 in) of rain fall per year. Here is the average rainfall in Santander. In Barcelona, the rains are not abundant, and residents are asked not to waste water. Here is the average precipitation. To the south of the Valencian Community, where the coast is exposed to the south-east, annual rainfall drops below 400 mm (15.5 in) per year as its mentioned in Spain rain map. In the Costa Blanca, precipitation is particularly scarce. In Alicante, just 285 mm (11.2 in) of rain fall each year. In the plateau, precipitation is not abundant (though it is quite frequent in winter) because the bulk of the moisture coming from the ocean falls as rain on the Atlantic slopes. In Madrid, precipitation amounts to 455 mm (18 in) per year.


