search
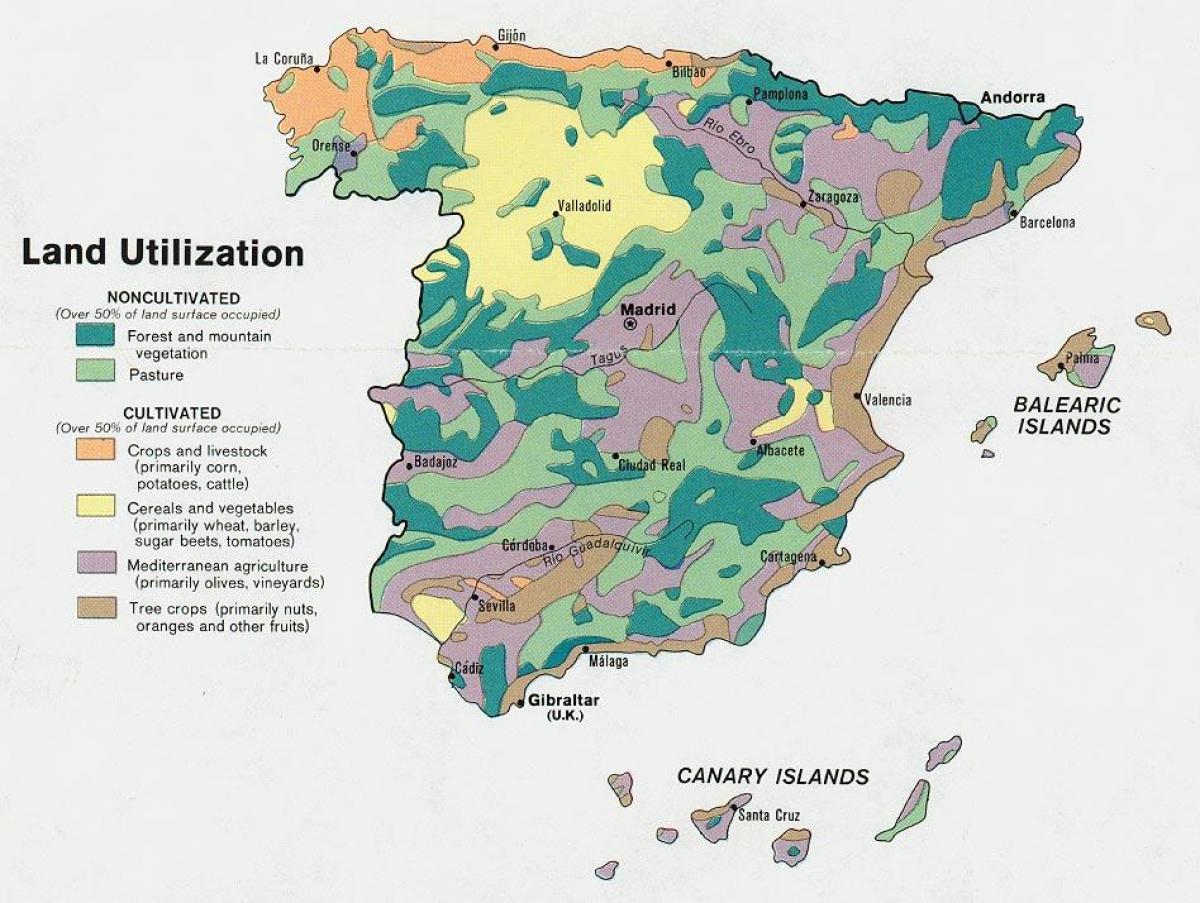
Spain agriculture map
Map of Spain agriculture. Spain agriculture map (Southern Europe - Europe) to print. Spain agriculture map (Southern Europe - Europe) to download. Compared with other West European countries, the proportion of land devoted to agricultural purposes is low. In the 1980s, about 5 million hectares were devoted to permanent crops: orchards, olive groves, and vineyards as its shown in Spain agriculture map. Another 5 million lay fallow each year because of inadequate rainfall. Permanent meadows and pastureland occupied 13.9 million hectares. Forests and scrub woodland accounted for 11.9 million hectares, and the balance was wasteland or was taken up by populated and industrial areas. Vegetables, fruits, and cereals are the principal crops, accounting for about three-fourths of Spain agricultural production (in terms of value), with cereals the principal crops.
Because of the relative decline of agriculture since the 1960s, Spain rural population decreased and many farms disappeared. Spanish agriculture has remained relatively backward by western European standards: capital investment per hectare is about one-fifth the average for the Organisation for Economic Co-operation and Development (OECD), and the vast majority of farms are small as its mentioned in Spain agriculture map. Since Spain joined the EEC in 1986, the Spanish agricultural sector has had to respect Europe-wide policies.


